June 14, 2022
SPY – Head and Shoulder to Watch | June 14th
DISCLAIMER: These videos are created by our stock market educator are for educational purposes only and should not be taken as financial advice. All strategies, stock picks, and market analysis discussed in the videos are purely the opinion of the educator and not meant to be taken as professional advice. Past performance of stocks and other investments are not indicative of future returns, and all risks associated with investing are the responsibility of the individual. We are not financial advisors and urge all viewers to do their own research and consult with a professional financial advisor before making any investing decisions.
Hey everybody. Johnny Seville from Acorn Wealth Corp — Smart Money Trading.
Let’s take a look at the market as we go into Tuesday, the 14th of June. Now, a few weeks ago in the third week of May, we we talked about the likelihood of a strong rally in the market and that a potential, at least short term bottom could be in. What we saw from the SNP 500 was a very strong, aggressive rally of close to 10% stemming from the 20 May straight upwards.
Now, this was after we got a bullish smart money divergence signal on the SPY and then we kind of broke through some of the momentum resistance. What happened then is we rallied straight into this kind of resistance area and started to consolidate in what could have potentially been a Bull flag.
And if you’ve been following some of our videos and ideas, this is the kind of thing that we said is one of the key things to watch was would this flag break out? And we were looking for a close above 420. That would be the bullish indication for it to stem upwards towards a target of around 436.
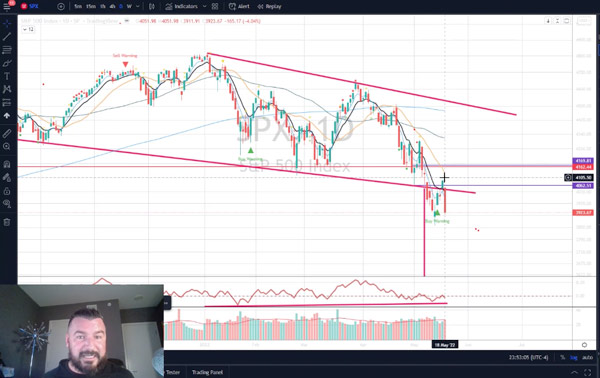
But if the SPY or was unable to break out of this bullish flag and in fact broke negatively, then we were likely to have a sharp shot downwards. So through that consolidation zone, you can see that indeed we did break negatively, fueled from the fear trade on the inflation data. But what you can also see and what’s more important than necessarily the headlines is what that means from a pattern perspective.
See, if we’d broken bullishly, we would have been more so in kind of this larger scale downward channel, which would have been very bullish because we didn’t break higher. This now lends itself to a more probable head and shoulders pattern. And so, as you can see, this is drawn out on the chart here with a left shoulder, head and right shoulder. And as you can see, where we’ve ended in Monday’s close is right down on that support level. So what does that mean for the market? W
ell, we took the long trade. Me myself personally, I went fairly long at this bottom and into that resistance have been doing some profit taking and protecting those original positions. So that was the way we traded the bounce. Others may have avoided the bounce and been waiting for the short side. You could have played it either way. But what about what happens next?
Well, we’ve had a very sharp drop. Considering we’re now at that support level. I’m going to be looking patiently to see what happens in Wednesday’s trading. If this is a head and shoulder and so far it’s making those noises, then we’re looking at a potential breakdown to around 332 on the Spy. So basically about a 40 point drop on the Spy.
But what we could see before that type of a drop is a bit of a dead cat bounce. See, after a really sharp drop, I’d be hesitant to be chasing shorts at this point. Same reason why after a strong 10% rally into resistance isn’t a great time to be adding new laws. You want to wait for that breakout?. Same kind of thing with where we’re at in the downward move.
But what we could see and I’m just playing out this potential scenario here, is we could see another smaller head and shoulder on the right. So this could be a little left shoulder ahead and you could see a little 395 or so on the Spy where a right shoulder could form. So if we see it rally up to that area and start to roll over and turn down, then you’re looking at a head and shoulder within a head and shoulder. And that would be really interesting. Those are kind of the things to watch.
Now, if by the off chance we were able to overcome this significant downward move and go sharper and higher than that potential right shoulder, then you’re looking at resistance again up into this area over here.
But that’s what we’re looking at from the SNP perspective.
The other really important thing that I’ve been telling people to keep an eye on is high yield bonds. Now, high yield bonds once again were a reason why we went long back in the third week of May was because we had again had a buy indication from our smart money divergence indicator and we broke through the moving average and had a nice sharp shot of power from the high yield bond market – very important leading smart money indicator. And that’s what gave us the confidence to take some of those speculative longs in late May.
Now, as that rolled over, that’s when we went into protection mode, like protecting that capital, doing some partial profit taking. And then as high yield bonds broke that 20 day moving average, that’s when the power shifted back from the bulls back into potentially bearish territory and where you want to go into defensive mode. High yield bonds has been a leading indicator in so many crashes and been a leading indicator in so many bottoms that it’s such an important thing to look at.
Now, as you can see when that continued to break down on Thursday and then Friday, that was a big signal that the market had lost that strong bullish move and that it shifted back to the bearish side. And what you can see here is that the high yield bonds have actually dropped into fairly strong fresh lows. Whereas if you look at things like the Russell 2000 still at equal lows, right, even if you look at the Spy, it hasn’t dropped significantly below those previous lows.
While we’re talking about the Spy, just take a look at where we’re at in relation to the 2020 lows and once again take a look at high yield bonds and look at where they are at in terms of relation to the high yield bond. Lows of 2020. High yield bonds are much further into their bearish territory and that bearish journey than the major US indexes are. And because high yield bonds is often a leading indicator that goes ahead of the market this just gives us an example of the potential bearishness ahead.
So the key takeaways in this kind of a market I think is patience obviously risk management and to not lock yourself into any one position, be aware of the data, be aware to be nimble with it and go in the direction of where probability is pointing you. As we go into Wednesday’s trading we’ll be watching for a potential dead cat bounce. We’ll be watching for how high it goes and then following the pattern as to what they may indicate next.
I hope that’s helpful and happy trading. Enjoy, take care.
Archive
- October 2024 (5)
- September 2024 (8)
- August 2024 (6)
- July 2024 (6)
- June 2024 (15)
- May 2024 (8)
- April 2024 (13)
- March 2024 (17)
- February 2024 (9)
- January 2024 (22)
- December 2023 (11)
- November 2023 (11)
- October 2023 (10)
- September 2023 (17)
- August 2023 (23)
- July 2023 (15)
- June 2023 (14)
- May 2023 (15)
- April 2023 (13)
- March 2023 (19)
- February 2023 (14)
- January 2023 (14)
- December 2022 (8)
- November 2022 (19)
- October 2022 (17)
- September 2022 (21)
- August 2022 (25)
- July 2022 (17)
- June 2022 (17)
- May 2022 (12)
- April 2022 (5)
- March 2022 (7)
- February 2022 (5)
- January 2022 (1)
- November 2021 (1)